Mathematical formulas used in lotteries are grounded in the principles of probability theory and combinatorial mathematics.
What do we mean when we discuss the intuitive notion of probability? Viewing it mathematically, two distinct ways exist to understand this abstract idea. In one interpretation, probability is linked to the frequency at which a specific event occurs over a series of trials where the event might or might not happen. Such occurrences are termed random by mathematicians.
So, how do we determine probability in lottery?
There’s a well-established principle known as the law of large numbers. This principle, backed by probability theory, posits that in any series of trials, as the trial count rises, the frequency of a random event gradually converges to a specific value. This fixed value can be denoted as the probability P(A).
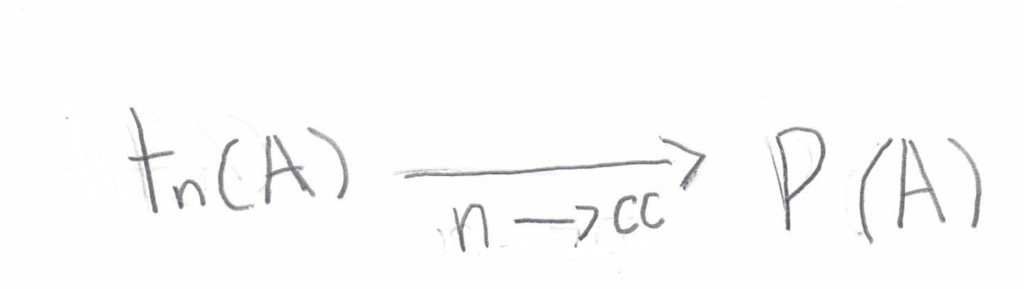
From this principle, it’s inferred that to ascertain an event’s likelihood, and one should execute a long series of trials and then convert the resultant frequency into a percentage.
Can we establish the probability of an event beforehand, that is, before initiating any trials?
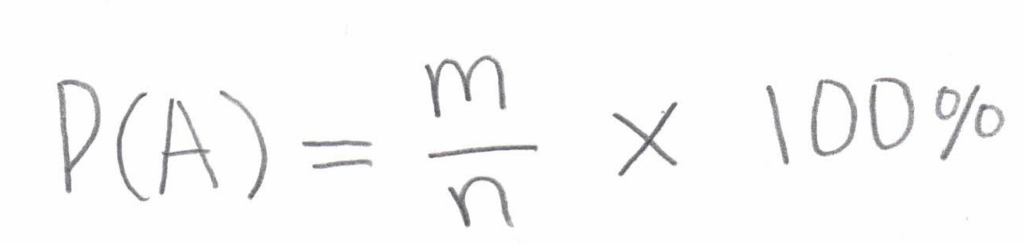
Surprisingly, under certain circumstances, this is achievable. The method to determine probability values before any event occurs relies on a second interpretation of its definition. In essence, the probability of an occurrence (denoted as event A) is the likelihood of its occurrence, represented as the ratio of favourable events (m) to the sum of all potential elementary events (n), and then expressed as a percentage.
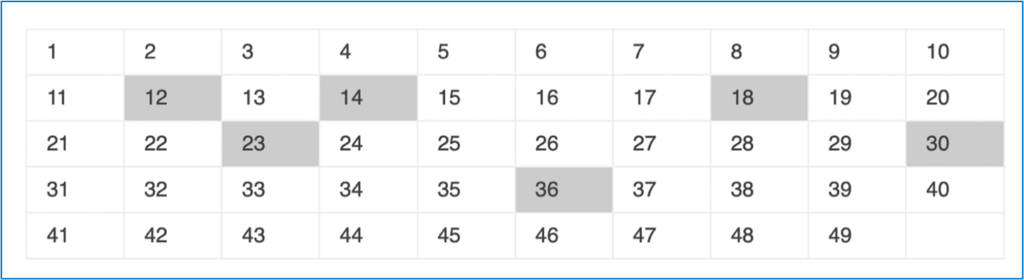
Let’s delve into a topic closer to our discussion: gauging the likelihood of correctly predicting numbers in the Lotto 6/49. Per this game’s rules, players must correctly predict six lucky numbers from a pool of forty-nine. For illustrative purposes, we’ll highlight the “lucky numbers.”
What’s the likelihood that a chosen number will be highlighted? It equates to the ratio of our favoured outcomes (highlighted numbers totalling six) to all potential consequences (49 digits). Hence, the odds of predicting one of the six lucky numbers are 6/49, and inversely, the odds of failing to predict it stands at 43/49.
Adding the probabilities of these two potential outcomes will yield a total chance of 1, unsurprisingly. After all, an event must occur or not (with a combined likelihood of 100%). As the saying goes, if I don’t win, I lose.
Upon a second draw, only 48 numbers remain (one number was already selected in the first draw). Here are the probable outcomes:
• If a lucky number was chosen in the first draw: The odds of selecting another random number drop to 5/48, whereas the odds of picking a non-lucky number are 43/48.
• If a non-lucky number was chosen first: The odds remain 6/48 for choosing a lucky number, while the odds for another one are 42/48.
With two draws, we can outline four potential outcome scenarios (considering both the first and second draw):
1. Correctly predicted + Incorrectly predicted: p = 6/49 x 43/48 = 0.1097
2. Incorrectly predicted + Correctly predicted: p = 43/49 x 6/48 = 0.1097
3. Correctly predicted on both counts: p = 6/49 x 5/48 = 0.0128
4. Incorrectly predicted on both counts: p = 43/49 x 42/48 = 0.7679
Clearly, in this scenario, the total probabilities sum up to 1.
Calculating the Total Possible Outcomes
One can observe that with increasing attempts, the total variations of possible outcomes grow exponentially. Specifically, for n drawing attempts, the potential outcome variations are 2^n. For instance, with three attempts, there are 2^3 = 8 possible outcome scenarios:
1. Correct + Correct + Correct: probability = 0.0011
2. Correct + Correct + Incorrect: probability = 0.0117 … and so on until:
3. Incorrect + Incorrect + Incorrect: probability = 0.6698
Computing Combinations
Given the possible variations, how many have the correct predictions? This count aligns with all potential combinations of correctly predicted numbers.
Suppose the numbers 12, 14, 30, and 36 are predicted correctly. How many variations exist for such a prediction? The number 12 can be guessed in any of the six attempts, meaning it can be named 1st, 2nd, 3rd, 4th, 5th, or 6th. Therefore, there are 6 different variations for guessing the number 12. The second number, 14, can be predicted in any of the remaining five attempts, so there are 5 different variations for indicating it. Following this reasoning, it’s easy to conclude that there are 4 different variations for predicting the number 30, and 3 variations for the number 36. Therefore, for predicting a set of four numbers out of the six “lucky” ones, there are a total of 6x5x4x3 variations. However, not all of these variations are distinct. Suppose these numbers were guessed in the first four attempts. Then all these variations, corresponding to a different sequence of filling in the “lucky” numbers in the same attempts (a total of 24 variations), actually represent one variation (the number of permutations of 4 elements is 4x3x2x1=24).
.
| Lucky Number | Attempts | |||||||||||||||||||||||
| 12 | 1 | 1 | 1 | 1 | 1 | 1 | 2 | 2 | 2 | 2 | 2 | 2 | 3 | 3 | 3 | 3 | 3 | 3 | 4 | 4 | 4 | 4 | 4 | 4 |
| 14 | 2 | 2 | 3 | 3 | 4 | 4 | 1 | 1 | 3 | 3 | 4 | 4 | 2 | 2 | 1 | 1 | 4 | 4 | 2 | 2 | 3 | 3 | 1 | 1 |
| 30 | 3 | 4 | 2 | 4 | 2 | 3 | 3 | 4 | 1 | 4 | 1 | 3 | 1 | 4 | 2 | 4 | 2 | 1 | 3 | 1 | 2 | 1 | 2 | 3 |
| 36 | 4 | 3 | 4 | 2 | 3 | 2 | 4 | 3 | 4 | 1 | 3 | 1 | 4 | 1 | 4 | 2 | 1 | 2 | 1 | 3 | 1 | 2 | 3 | 2 |
We have arrived at the following formula:
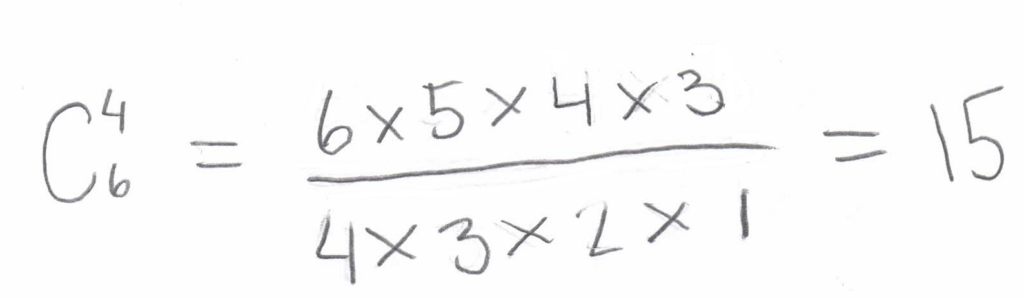
This formula for the number of combinations is valid for any other marked and predicted numbers. In general, one can formulate the following rule: to determine the number of possible variations with m guessed numbers out of n marked numbers, it is necessary to calculate the number of combinations:
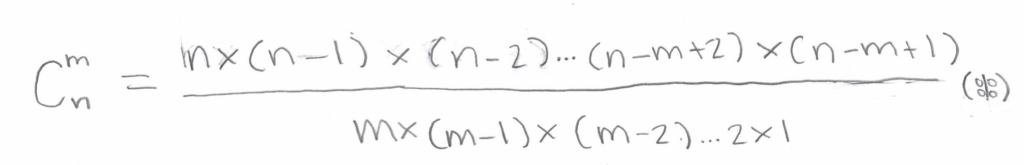
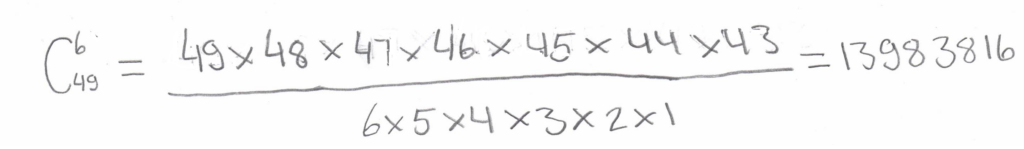
In this formula, the number of factors in the numerator and the denominator are the same and equal to m. The total number of possible combinations for lottery games is also calculated using this formula. And for the Lotto 6 out of 49, we get:
Average Winnings per Combination
To evaluate winnings, we consider the average for each prize category, calculated by multiplying the winning probability by the total prize money.
Mathematical computations suggest the average winnings are consistent across both simple and expanded gaming systems, irrespective of the number of chosen numbers. However, the two approaches differ in payout: more marked numbers often result in more significant winnings but decrease the likelihood of smaller wins.
Chances of Consecutive Losses: Wondering about the odds of repeated losses when betting on the same combination every time? Bernoulli’s formula can help. This formula calculates the probability that after n-game rounds, there’ll be m rounds without a win.
For example, using Bernoulli’s formula, probabilities of loss over four draws were found to be:
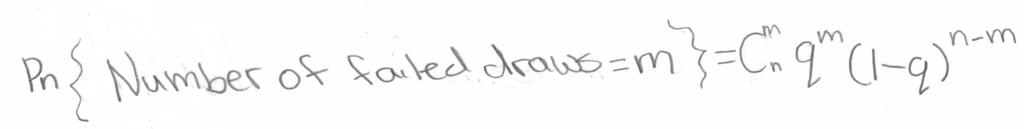
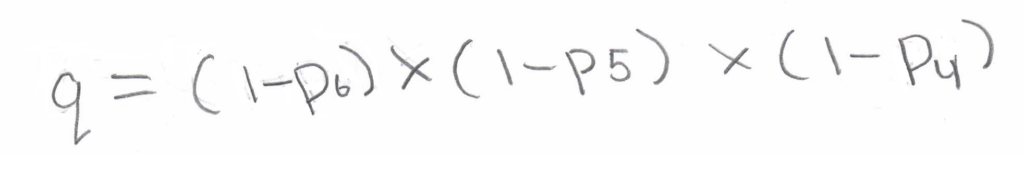
It allows you to find the probability that, as a result of participating in n rounds of the game, the number of rounds without a single win will be m: Probability of a series of failures – Bernoulli formula where q defines the probability of an “unfortunate” outcome just for one round, i.e., 6, 5, and 4 numbers were not guessed and is determined by the formula:
For example, based on Bernoulli’s formula and some initial statistical data, the following probabilities of failure for 4 draws were obtained:
1. There was no win: m = 4, P = 0.02 (2%)
2. There was one win: m = 3, P = 0.13 (13%)
3. There were two wins: m = 2, P = 0.33 (33%)
4. There were three wins: m = 1, P = 0.37 (37%)
5. All rounds were winning: m = 0, P = 0.15 (15%) 2% + 13% + 33% + 37% + 15% = 100%
As we can see, the probability of consecutive losses with the same combination of numbers decreases with an increasing number of participations. Still, the appearance of a win does not guarantee that it will be significant.
From the above, it’s evident that the chances of sequential losses using the same combination decrease with more game participation. However, a win doesn’t ensure a significant prize.
Despite the randomness of game results, is there an optimal strategy? The best advice might be to select and adhere to a game system consistently and prudently.
There are a few software products built on similar approaches; the one that is lottery focused is called Draw Dynamics. They try to predict the next winning combination using probability theory and the Bernoulli approach.
Despite the randomness of game results, is there an optimal strategy? The best advice might be to select and adhere to a game system consistently and prudently.